
Compare crop varieties
Explore planted-area reporting across the crop varieties in the dataset.
A clearer view of crop-farmer data
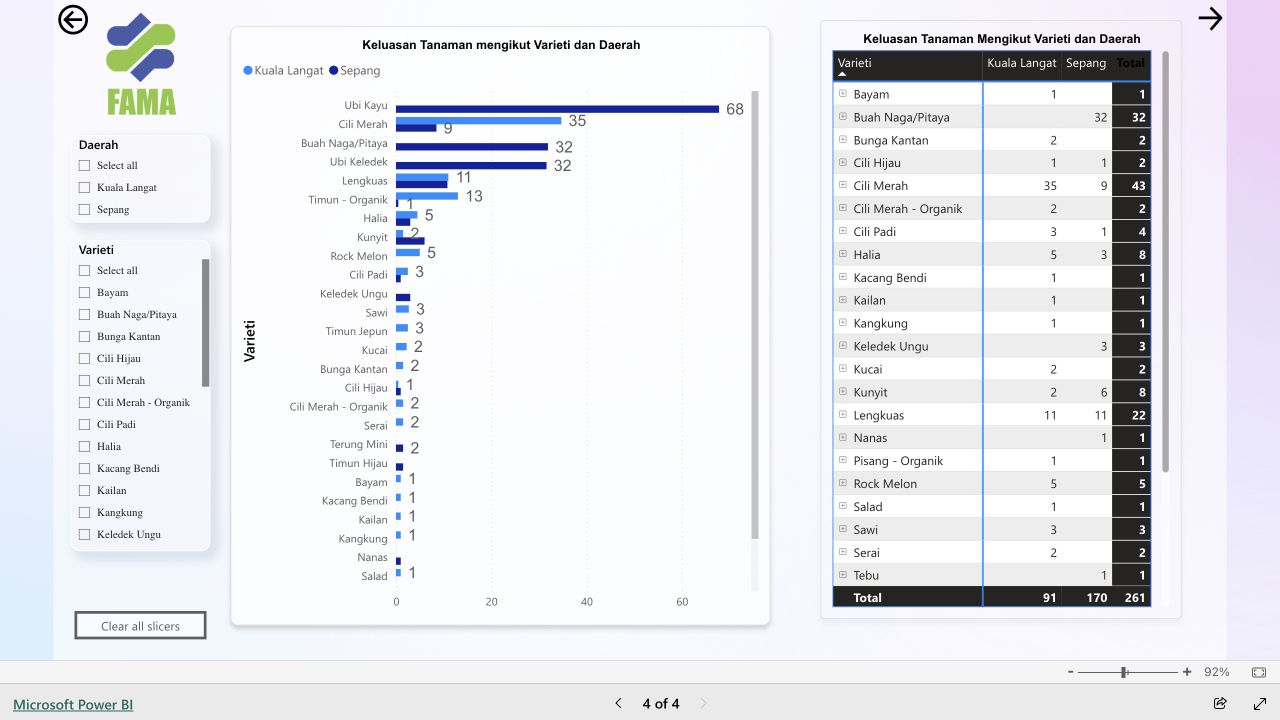
Agricultural production records can be difficult to interpret when explored only as raw tables. This dashboard organises crop-farmer information into a visual reporting experience.
The report includes a comparison of planted area by crop variety across Kuala Langat and Sepang, with district and variety filters and a supporting breakdown table.
Explore planted-area reporting across the crop varieties in the dataset.
Use the district and variety filters to compare the available records for Kuala Langat and Sepang.
Read the supporting variety-by-district table alongside the visual comparison.
Tell me about your project, the challenge you want to solve and your target timeline. I’ll help you work out the next step.